© University of Kent - Contact | Feedback | Legal | FOI | Cookies
Carbon, Energy, and Water
We measure and report on our Electricity, Gas and Fuel consumption annually. Our Carbon Management Plan Statement 2020-2040, sets out a 20 year aim to reduce our Carbon Emissions to net zero by 2040.
Our Carbon Management Strategy supports the Carbon Management Plan and describes the methodologies used to achieve the required emissions reduction targets. The Strategy is in turn supported by the Utilities Measurement, Monitoring and Reporting Procedure and the Energy and Water Management Action Plan.
All of the documents mentioned above are available for download by clicking on the links in the side panel to the right. There are also links to our Water Management Strategy and a document detailing our procedures for handling fluorinated gases.
Carbon Emissions For the year 2021-22
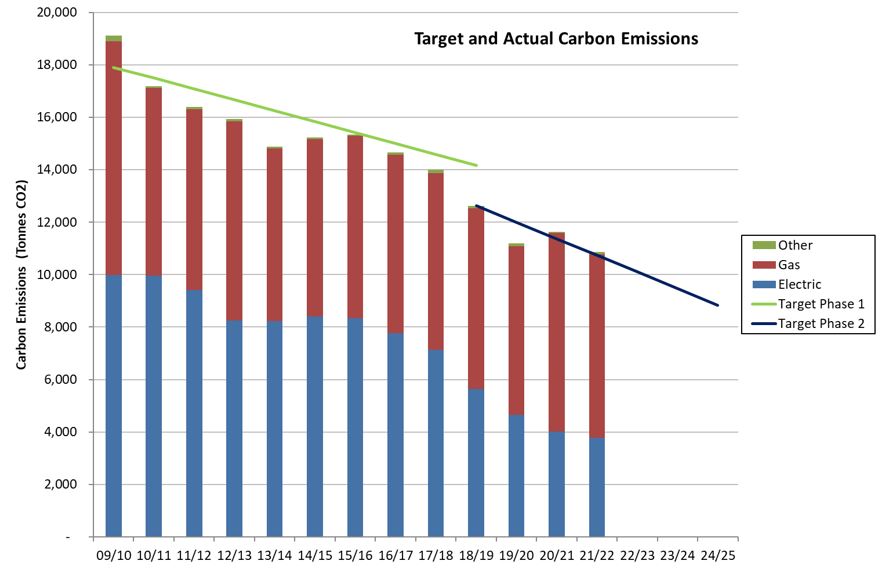
The year 2021-22 was a difficult year for managing energy consumption, given the need to provide additional ventilation in response to Covid 19. This requirement combined with the fact that the winter 2021-22 was the coldest in the last 5 years drove up gas consumption, and the associated carbon emissions. The effect of this is shown in the Carbon Emissions graph below.
The University implemented a series of carbon saving reduction measures during 2021-22, and these will have helped limit the increase in annual carbon emissions seen in the year. Following on from this the University continually reviews how it operates to maintain energy efficiency dependant on operational requirements. Further the University works in Partnership with other organisations to reduce carbon emissions, and is working to increase this type of engagement with a view to keeping the University on track with the targets set out in the Carbon Management Plan.
2021-22 Energy Data Breakdown by Consumption
2021-22 Energy Data Breakdown by Carbon Emissions
| KPI | Units | Residential | Non-residential | Total |
|---|---|---|---|---|
| Total Electricity | kWh | 3,999,689 | 14,793,304 | 18,792,993 |
| Total Gas | kWh | 15,086,638 | 23,162,072 | 38,248,710 |
| Total Fuel Oil | kWh | 0 | 139,014 | 139,014 |
| Total Fuel | litres | 18,825 | ||
| Total Renewables | kWh | 178,093 |
2021-22 Energy Data Breakdown by Carbon Emissions
| KPI | Units | Residential | Non-residential | Total |
|---|---|---|---|---|
| Total Electricity | TCO₂ | 805 | 2,978 | 3,783 |
| Total Gas | TCO₂ | 2,758 | 4,234 | 6,992 |
| Total Fuel Oil | TCO₂ | 0 | 37 | 37 |
| Total Fuel | TCO₂ | 0 | 50 | 50 |
| Total Renewables | TCO₂ | 0 | 0 | 0 |
| Total Emissions | TCO₂ | 10,862 |
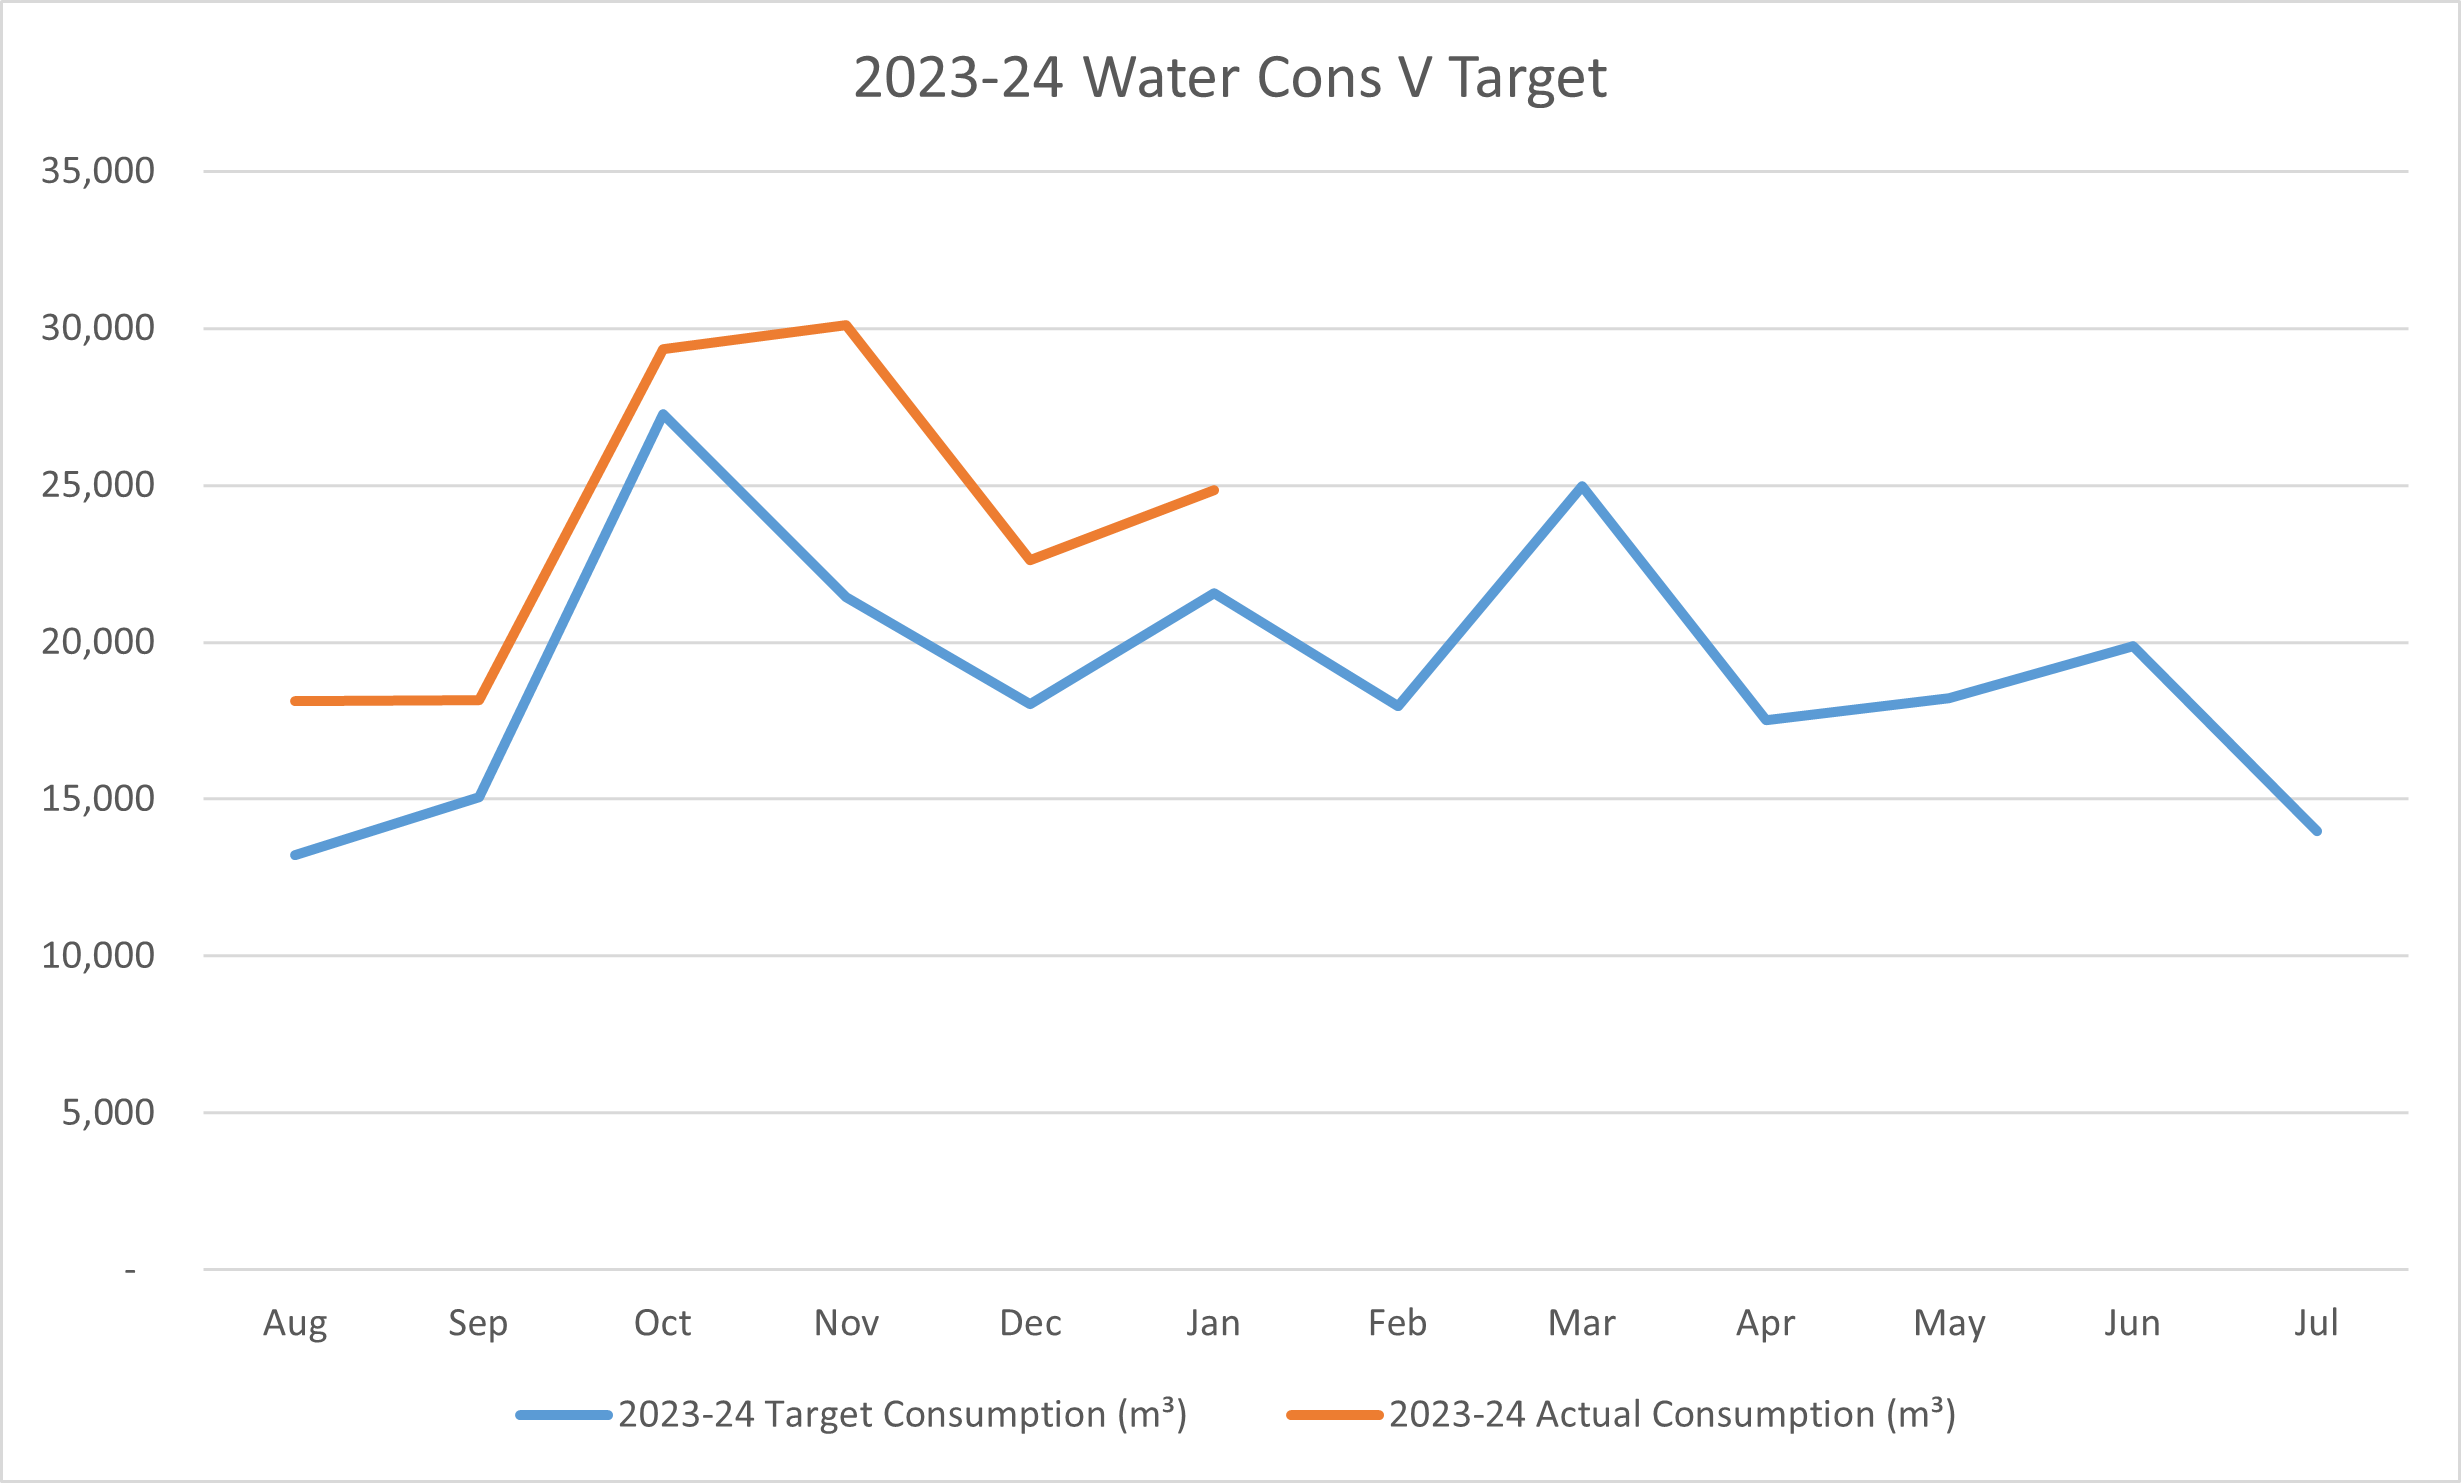
| Aug 23 | Sep | Oct | Nov | Dec | Jan 24 | Feb | Mar | Apr | May | Jun | Jul | Total | |
|---|---|---|---|---|---|---|---|---|---|---|---|---|---|
| 2023-24 Target Consumption (m³) | 13216 | 15049 | 27271 | 21427 | 18017 | 21577 | 17954 | 24962 | 17517 | 18232 | 19866 | 13983 | 229072 |
| 2023-24 Actual Consumption (m³) | 18123 | 18149 | 29327 | 30110 | 22610 | 24836 | 143155 | ||||||
| Cumulative 2023-24 Target Consumption (m³) | 13216 | 28266 | 55537 | 76964 | 94982 | 116558 | 134512 | 159475 | 176992 | 195224 | 215089 | 229072 | 229072 |
| Cumulative 2023-24 Actual Consumption (m³) | 18123 | 36272 | 65599 | 95709 | 118319 | 143155 | |||||||
| Cumulative Variation (m³) | 4907 | 8006 | 10062 | 18745 | 23337 | 26597 | |||||||
| Cumulative Variation (%) | 37.1% | 28.3% | 18.1% | 24.4% | 24.6% | 22.8% | |||||||